Visual Analysis Software
Advertisement
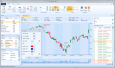
CandleScanner v.4.3.0.5
CandleScanner is a technical analysis software package created for investors interested in Japanese candle patterns. What makes this application exceptional is that it has been specifically designed for the detection of Japanese candle patterns.
Advertisement
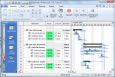
RiskyProject v.6
RiskyProject is a project risk management and schedule risk analysis software. Project managers can use RiskyProject for project risk management and risk analysis of projects and portfolios with multiple risks and uncertainties.
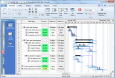
RiskyProject Lite v.6
RiskyProject Lite is a schedule risk analysis software. Project managers can use RiskyProject Lite for schedule risk analysis of projects and portfolios with multiple risks and uncertainties.
AlterWind Log Analyzer Standard
AlterWind Log Analyzer is the unique web server log analysis software that offers comprehensive reports on every possible aspect of web site operation otherwise left hidden from your eyes! Use this user-friendly software to grab web server logs (all
MB Free Graphology
MB Free Graphology is a free graphology or handwriting analysis software. It is an advanced yet simple and handy program that helps you to understand the significance of your handwriting. handwriting. It is with the help of this software that you come to
RadarCube ASP.NET OLAP Chart for MSAS v.2.70.0
ASP.NET and Silverlight OLAP control to add Visual Analysis to your applications. Displays business data on the internet in charts and graphs rather than in numbers. Works with MS Analysis Services OLAP Server. 100% managed code authored in C# 2.0

MB Graphology
MB Graphology is a free graphology or handwriting analysis software. It is an advanced yet simple and handy program that helps you to understand the significance of your handwriting. handwriting. It is with the help of this software that you come to know
RadarCube WPF OLAP Grid and Chart v.1.30.0
A set of WPF controls (OLAP Grid and OLAP Chart) to add OLAP and Visual Analysis functionality to your WPF applications. OLAP Grid displays data in an interactive pivot table and OLAP Chart shows the same data in charts and graphs.
RETScreen v.4.0.14
The RETScreen Clean Energy Project Analysis Software is a unique decision support tool developed with the contribution of numerous experts from government, industry, and academia.
TradingSolutions v.4.08.0403
TradingSolutions is a financial analysis software package that combines traditional technical analysis with state-of-the-art artificial intelligence technologies.
Insider 3000 v.3 2
Insider 3000 is one of the best technical analysis software. Features: -Real Time: Insider 3000 can receive data in real time, connecting directly with selected data providers, or to any provider with a DDE (Dynamic Data Exchange) interface.